
Drone-based aerial mapping/modeling is a quickly deployable, efficient, and affordable way to get custom visualization and measurement for projects such as: new developments, quarry stockpiles, solar installation planning, vacant land marketing, construction site progress tracking, accident sites, and structural insurance claims.

3D scan for solar installation shadow casting model
Drone surveys of most sites <100 acres can be completed in less than one hour, compared to a full day or multiple days for traditional survey methods. Drastically reduced cost vs traditional methods open data use up to even small, personal projects.
Our years of experience include flight planning, execution, and data processing with a variety of industry leading platforms/software including DroneDeploy, Metashape, Pix4D, Reconstruct, Scanifly, and Skycatch.
Is your company already working directly with a data processing provider and simply in need of an experienced pilot to fly the data capture? We have you covered. Whether utilizing our own drones and software or piloting a provided system, we have experience flying data capture with a variety of drones
Completed maps can be generated in both 2D and 3D, depending on intended use.
3D terrain and surface models can be exported as point clouds, 3D wire mesh, contour lines (topo maps), and other file types useful in CAD and design programs.
2D map mosaic images are geo-referenced and can be exported in file types compatible with Google Earth/Maps and popular GIS programs.

Contour map created for client’s architect to use in AutoCAD
Common uses for drone-based mapping include: render overlays, excavation planning, landscaping, construction site modeling, construction site progress monitoring, printing large size high resolution maps, mining/quarrying material volume measure, as a faster and more affordable alternative to traditional surveying, and as virtual tours of property for marketing.

Not a photo. This is a 3D model created with drone scan data, used to measure quarry stockpile volume.
Map resolutions greater than 1 inch per pixel are possible (compare to Google Maps' average resolution of 10 inches per pixel), offering a very fine level of detail and a high degree of accuracy at a price far more affordable than traditional photogrammetry methods.

Resolution comparison: 200ft AGL drone imaging (suitable for areas <100 acres) overlaid on standard satellite imagery.


No project is too small. This 3D scan was used for landscape measuring/planning of client’s lawn area
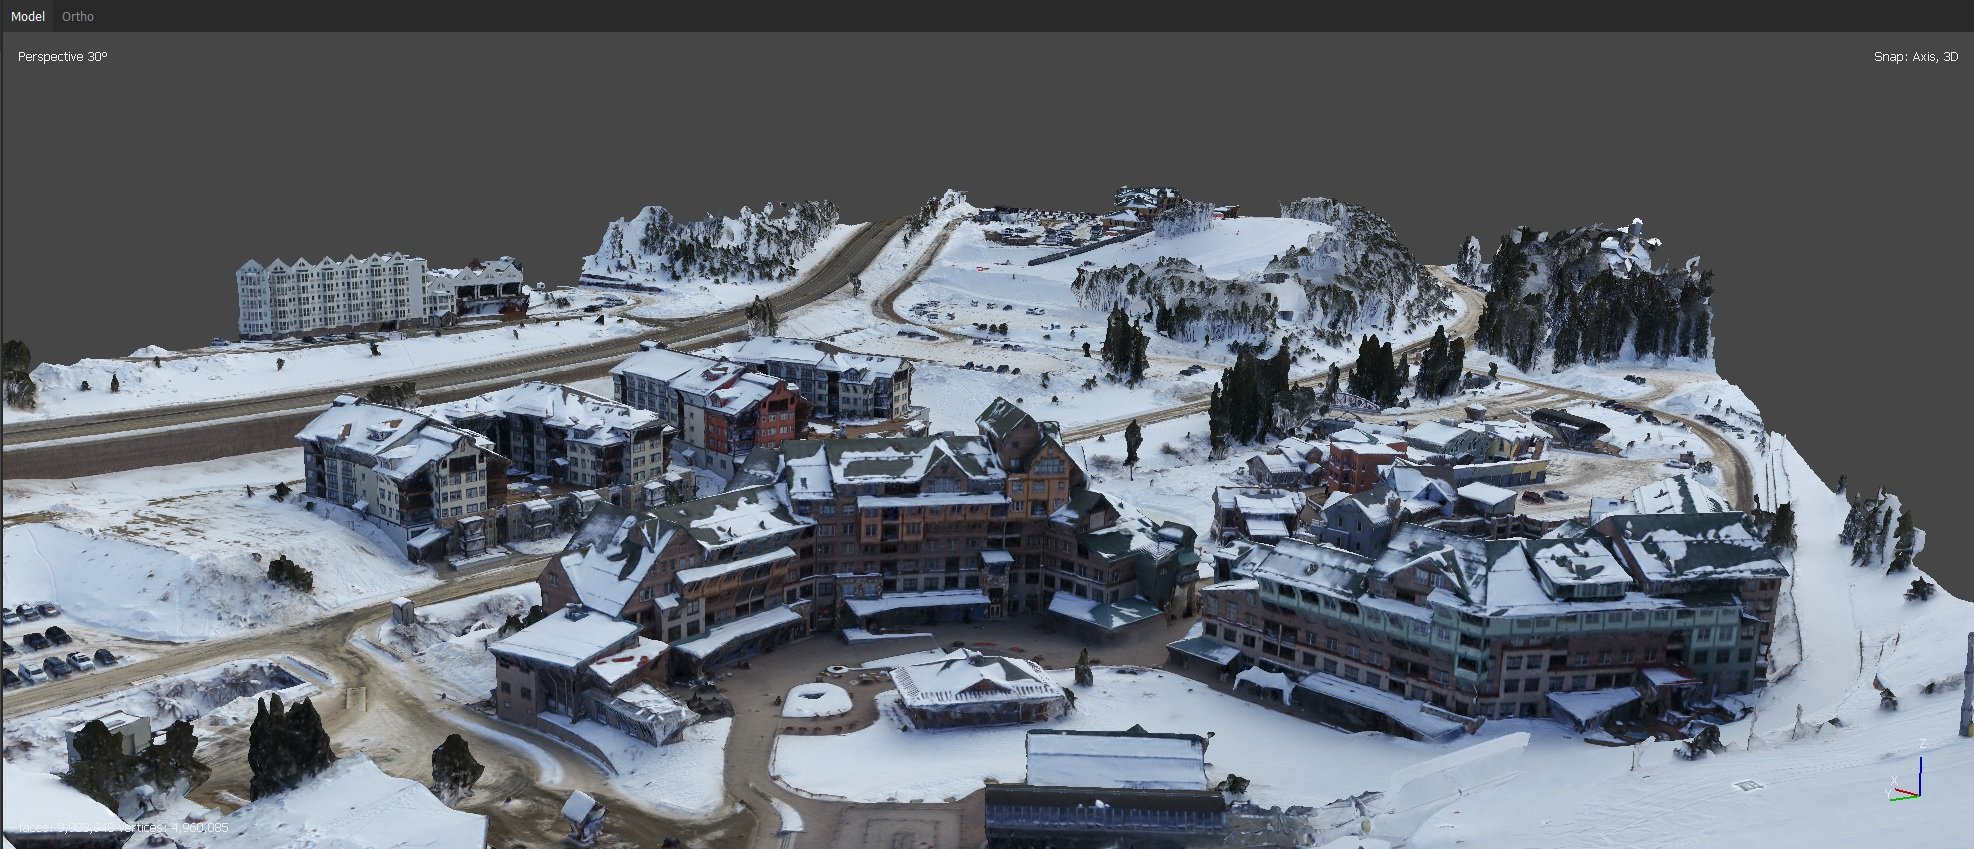
Large-scale projects are also possible. We 3D modeled the entire Winter Park ski village for a client that wanted to have a realistic, up-to-date base model for their proposal renderings.
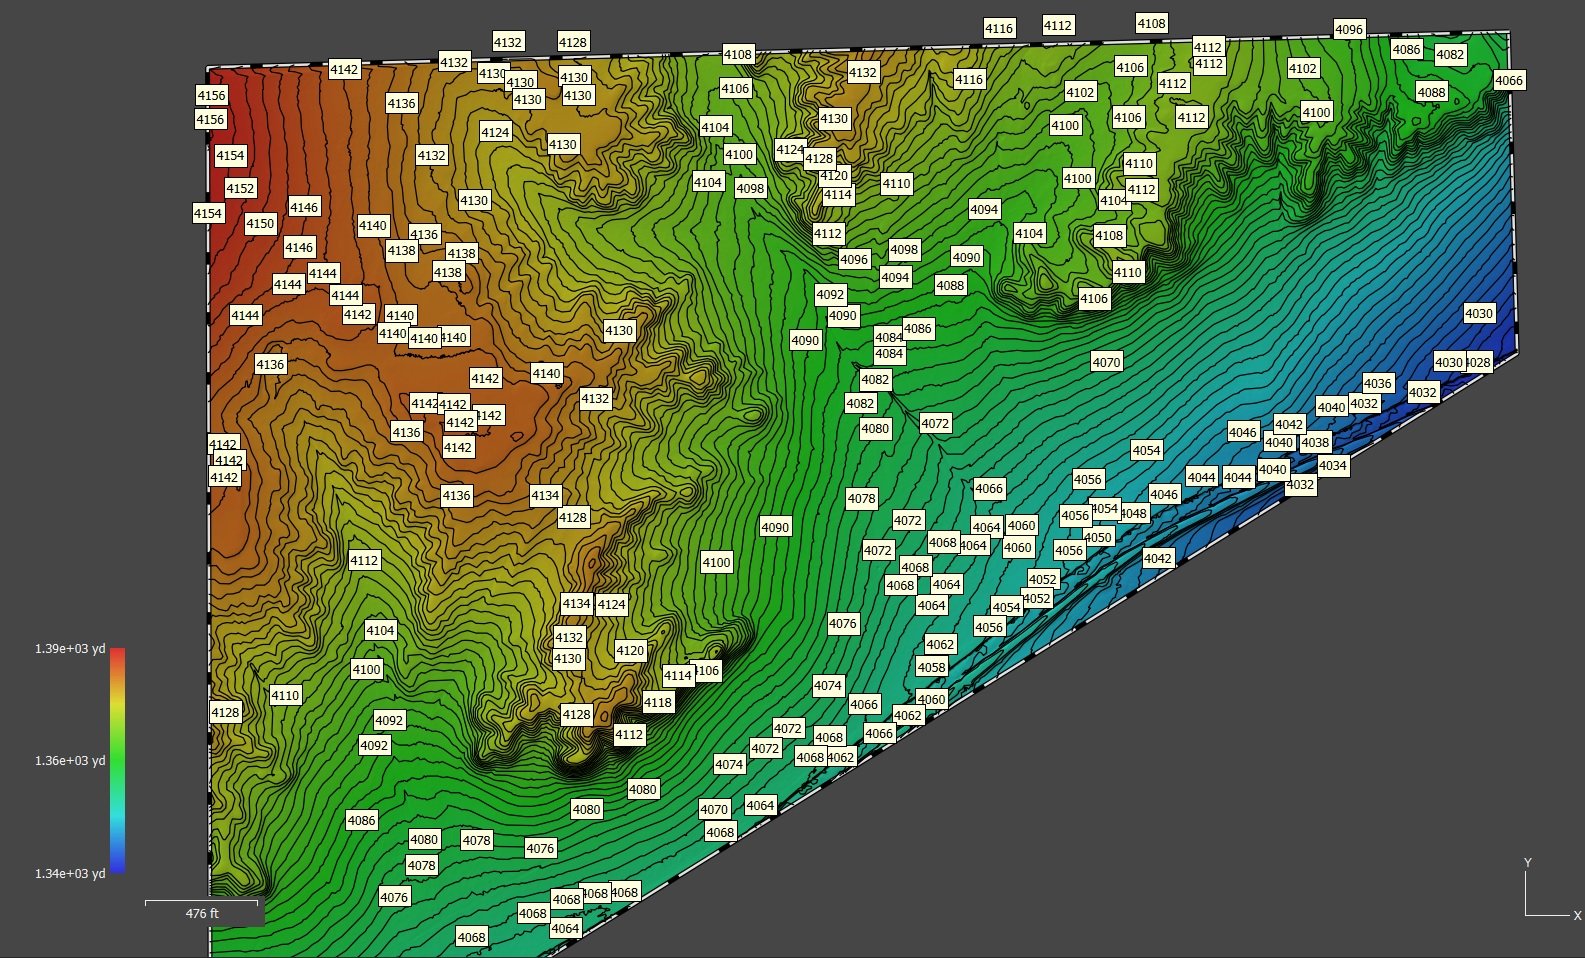
Survey-accurate NAD88 contours generated with the aid of ground control points.

Contour lines generated for a client to use with CAD design of a future build on this mountain property.
The screenshots below show examples of some of the possible output options and uses for 3D scan data of a hillside at a proposed building site. All images use the same survey data and can be created simultaneously in a single processing step, speeding turn around time on your project.
A contour/topo map made to custom specifications, output as a .dxf or .shp for use in GIS and CAD programs.
A custom spec contour map overlaid on the GeoTIFF. This combination gives the visualization and GPS tagging of the GeoTIFF imagery, while also allowing for elevation visualization with contour lines.
This 3D textured mesh is output as an .obj file which is usable in Windows native 3D viewers. The floating object can be spun, zoomed, rotated, and flipped in any direction to get virtual views of any position on or above the ground, or simply to get a quick read of site topography.
This geo tagged .tiff is being used in QGIS to take an area measurement of the piece of land marked off in orange.
Volume measurements of both piles and pits can be taken within the data processing software. The above example shows the measured volume required to fill the trench marked off in bright green.